Econometric analysis of the correlation between CBOT/MATIF futures prices and physical CPT prices of Ukrainian ports for effective hedging purposes
Authors
Lesyk Ruslan
Share
Annotation
The article examines the suitability of CBOT and MATIF/Euronext futures exchange indices for hedging price risk in the physical market of Ukrainian port commodities. The study focuses on the basis, which is the main factor that causes differences between futures and physical prices in cross hedging. It takes into account differences in contract specifications, such as the quotation currency, units of measurement, and delivery parameters. Additionally, it considers the presence of a logistics component in the price of CPT goods, as defined by Incoterms 2020 rules. The empirical part of the study compares time series of stock prices and open indicative prices of CPT commodities, reducing them to a common measurement scale. A reproducible procedure is proposed for calculating the optimal hedge coefficient based on the criterion of minimum variance and subsequently assessing the effectiveness of hedging by reducing the variation in the outcome of the physical + futures portfolio, with stability checks on sliding windows. The results can be applied to selecting a benchmark and determining hedging parameters, considering the underlying risk.
Keywords
Authors
Lesyk Ruslan
Share
Relevance of the study
The relevance of this study stems from the fact that the global grain and oilseed markets in recent years have been characterized by increasing price volatility and frequent market shifts. This makes it more challenging for participants in the physical trading market to establish margins and plan their cash flows. As a result, international food prices, after reaching a sharp peak in the spring of 2022, continue to be sensitive to supply shocks and logistics disruptions. This highlights the need for effective risk management and hedging strategies among market participants.
At the same time, practical hedging of the physical CPT position in Ukrainian ports is based on exchange benchmarks, primarily CBOT and MATIF futures. These benchmarks are widely used for pricing and managing price risk. MATIF, which is a benchmark for European wheat, is seen as a key reference point for the European wheat market. Participants in the supply chain as a tool for hedging use it. The CBOT contract infrastructure, on the other hand, provides transparent expectations and a way to measure market uncertainty, including through implied volatility indices.
Under these circumstances, an econometric analysis of the connection between the CBOT/MATIF and Ukrainian ports becomes a practical necessity: it allows us to check the stability of price transmission and, if there is a long-term relationship, assess the dynamics of correlation and volatility. This, in turn, helps us to justify the choice of a benchmark and hedge parameters on a statistically reliable basis. This enhances the quality of management decisions for exporters, processors, traders, and financial departments by reducing the risk of a "formally" hedged position that, in practice, does not protect against potential losses due to gaps in the underlying asset.
The purpose of the study
The aim of this research is to investigate the correlation between the CBOT/MATIF future prices and the physical CPT prices of Ukrainian ports, and on this basis, to determine the most suitable benchmark and hedging parameters. This includes calculating the optimal hedge ratio and assessing the effectiveness of the hedging strategy.
Materials and research methods
The empirical basis includes exchange rates of CBOT and MATIF/Euronext futures, as well as open indicative prices of physical CPT in Ukrainian ports for the same period. The data has been converted to a single currency and measurement unit, synchronized by the observation dates, and aggregated into a common frequency. The methods used are econometric time series analysis, estimation of price connectivity and basis, calculation of the optimal hedge coefficient by the criterion of minimum variance, and evaluation of the effectiveness of hedging to reduce the variation of the result when compared with an unprotected physical position.
The results of the study
The research is based on the idea of coordinating exchange rates and local physical prices through the "basis" mechanism and transmitting price signals along the supply chain. The Chicago Board of Trade (CBOT) exchange-traded futures, specifically Chicago SRW Wheat Futures, form a public, high-frequency price indicator that is fixed in a standardized contract structure (contract volume: 5,000 bushels, quote: US cents per bushel, base asset: wheat with approved grades and quality allowances/markdowns) [3].
At the same time, European milling wheat futures (MATIF/Euronext Milling Wheat No. 2) reflect a different institutional context. The lot size is 50 tons, and delivery months include March, May, September, and December. Physical delivery takes place to a network of approved elevators in France.
These differences are important for hedging because the "comparability" of futures and physical prices depends not only on the commodity itself but also on the units of measurement, the quotation currency, the supply structure, the listing seasonality, and the quality rules that determine which physical flows are "embedded" in the exchange benchmark [6].
The interpretation of CPT in Ukrainian port prices requires special attention. CPT (Carriage Paid To) under Incoterms implies that the seller is responsible for transportation costs to the agreed-upon destination, and risk transfers to the buyer when the goods are handed over to the first carrier. In practical market communication, "CPT port" is often used as a shorthand for "delivery price with delivery to port/port-side logistics," where internal logistics elements are already included in the quotation, and often the port infrastructure is accounted for in the terms of the specific transaction. That is why linking a CPT (Cost, Insurance, Freight) port to exchange-traded futures is not the same as linking a spot market to a futures contract. The CPT Price inevitably includes a transportation and logistics component, as well as local port operating restrictions and regional competition for transshipment capacity. These factors create specific underlying dynamics that make the topic of "effective hedging" more practical than purely academic.
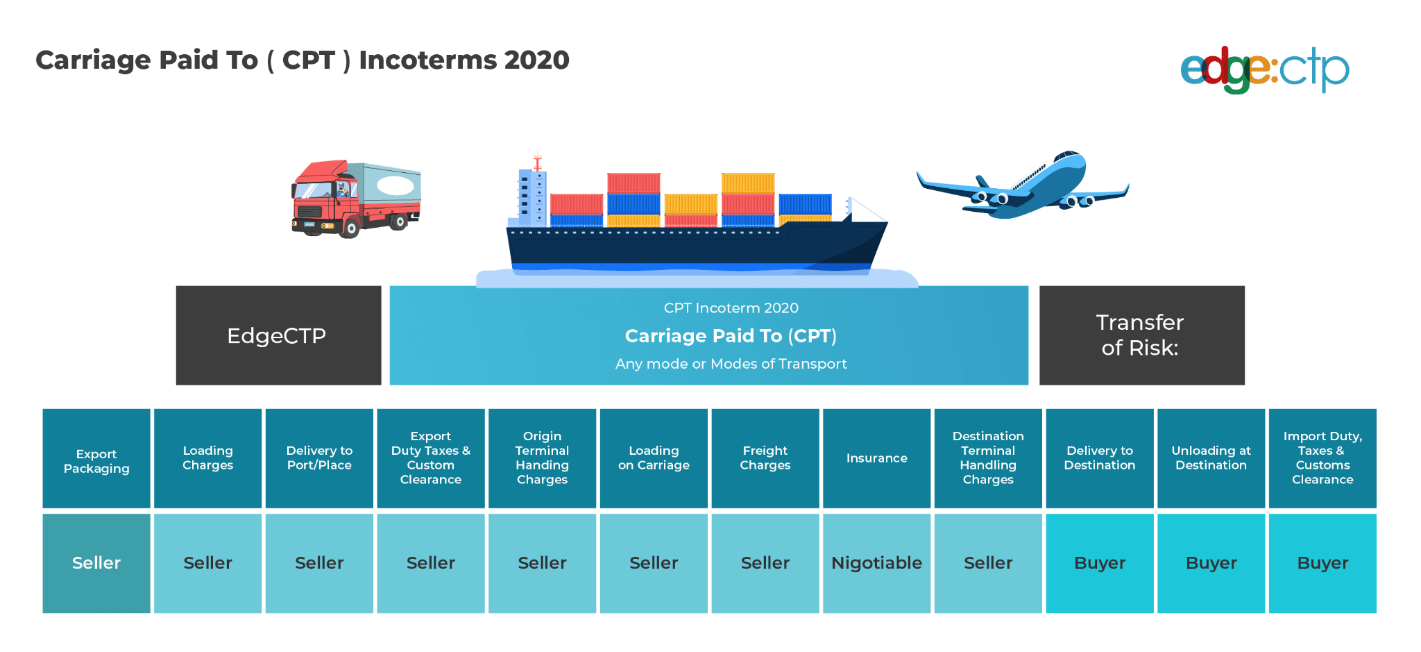
Fig. 1. Carriage Paid To (CPT) conditions for Incoterms 2020: cost allocation by stage and time of risk transition [2]
Table 1 summarizes the standard parameters of two important futures benchmarks, which will later be used as candidates for constructing hedging positions and testing cross-market price relationships.
Table 1
Comparison of CBOT and MATIF futures benchmarks/Euronext
|
Characteristic |
CBOT Chicago SRW Wheat Futures (ZW) |
Euronext/MATIF Milling Wheat No.2 |
|
Trading unit |
5,000 bushels |
50 tons |
|
Quotation unit |
US cents per bushel |
of euros per ton |
|
Type of delivery |
physical delivery according to exchange rules (deliverable grades / quality allowances) |
physical delivery; expiration dates March/May/ September / December |
|
Listing (basic) |
key months are specified in the futures trading rules |
March / May/September/ December; 12 consecutive deadlines are listed simultaneously, |
|
The logic of "proximity to the physical market" |
linked to the North American supply infrastructure and grade/quality tolerances |
linked to the European supply infrastructure (approved elevators in France) |
A source: author's development based on [3].
To "clarify" the relationship between futures and the port for verifiable components, the article uses a structural representation of the physical price. The price is the sum or difference of the observed components: the futures benchmark (a global signal), the currency revaluation, the logistics, and a local premium or discount (including infrastructure constraints and demand for transshipment).
The institutional specifics of the port segment are also reflected in the aggregated performance indicators for ports, which provide a background for interpreting the "local" component. By the end of 2022, seaports had handled more than 59 million tons of cargo; exports accounted for 47.8 million tons and imports for 6.2 million tons. Grain cargoes made up a significant portion of the nomenclature structure, with 28.8 million tons allocated. This information is essential for correctly interpreting econometric results, as when the throughput and availability of port logistics change, the "baseline" may shift, even with a stable stock market backdrop. The effectiveness of hedging then depends on how well the risk of a local bottleneck is reflected in the chosen futures instrument [5].
The empirical part of the study is based on the combination of three types of data: stock prices from CBOT and MATIF/Euronext, physical quotes from CPT ports as a proxy for real cash flows under supply contracts, and auxiliary series for "stitching" measurements, such as exchange rates and unit conversion. The exchange block is fixed according to official contract specifications, making it possible to unambiguously determine the unit of trade, quote currency, and delivery/expiration parameters, which are essential for constructing a continuous futures series for econometric analysis.
For CBOT SRW Wheat Futures, key parameters are set by CBOT rules (5,000 bushels, grade/quality tolerances, price steps, and trade specifications), as well as the CME product card. For the European benchmark, expiration parameters (March, May, September, December), the physical nature of delivery, and lot size (50 tons) are confirmed by regulatory disclosure documents under the Milling Wheat No. 2 contract.
The physical CPT (cost per ton) block is a sequence of indicative prices for a specific supply basis. These prices are usually presented in range format. To demonstrate the availability and regularity of these quotations, we can use the weekly grain market report for March 6-13, 2023, which publishes price ranges for CPT ports (including Odessa and Reni), wheat classes, and feed items. Additionally, it also publishes CPT prices for corn (Table 2).
These quotes are used to calculate a working indicator for the physical price, such as the middle of the price range. If necessary, they can also be used to assess the "spread within quality" for different types of products, such as flour and feed, to avoid mixing price risk with quality risk.
Table 2
An example of open CPT quotes (USD/t) used as a source of a physical series
|
Product/Quality |
The basis |
March 13, 2023 |
March 6, 2023 |
|
Wheat Grade 2 (12.5%) |
CPT Odesa |
210-220 |
215-225 |
|
Wheat Grade 3 (11.5%) |
CPT Odesa |
205-215 |
205-215 |
|
Wheat forage |
CPT Odesa |
195-205 |
195-205 |
|
Wheat Grade 2 (12.5%) |
CPT Reni |
205-215 |
210-215 |
|
Corn fodder |
CPT Odesa |
205-210 |
205-210 |
|
Corn fodder |
CPT Reni |
205-215 |
205-215 |
A source: author's development based on [1].
The structure of the study is designed in such a way as to ensure consistency in periodicity and "moments of observation." Stock prices are recorded on a daily basis, while CPT quotes can be published daily or weekly. Thus, the main frequency for econometric analysis is the frequency of constant monitoring of physical prices, which is most often weekly. Stock indexes are summarized by these dates, either by the calculated value on the day of publication of the actual quotation, or using the average value for the week, depending on how the CPT indicator is defined in the source. At the variable level, the conversion of units and currencies is separately recorded: the CBOT price from cents/bushel is converted to USD/t using standard coefficients, and the European contract is converted to comparable USD/t using the EUR/USD exchange rate and lot size, so that all series are on a single measurement scale before evaluating correlations, cointegration and hedge parameters.
The econometric strategy outlined in the chapter includes: (i) an initial analysis of the time series properties (such as stationarity and integration), (ii) examining the long-term correlation between the physical CPT price and the futures reference price (across various windows), and (iii) assessing hedging parameters, with the primary practical metric being the reduction in the variance of physical price changes when employing a futures position (a classic «minimum variance» approach through the calculation of the hedging coefficient). A crucial aspect of the design involves addressing «regime shifts» and the asynchrony of trading hours and publications. Since different sources generate prices at varying times and using different valuation methods, the model incorporates robustness to temporal shifts and evolving relationship parameters over time (using rolling estimates). This ensures that conclusions about hedge quality are not confined to a single period and are not an artefact of calendar alignment.
The move from identifying the statistical relationship between futures and physical prices to implementing a practical hedge starts with selecting an objective function. In applied grain trading tasks, the focus is usually on minimizing the variance (volatility) of the financial outcome for the physical position while preserving the economic essence of the transaction. Here, the hedge is seen as a means of mitigating price risk rather than generating speculative profit. In this context, the optimal hedging ratio is derived from the covariance of changes in physical and futures prices relative to the variance of futures price changes. Empirically, this can be conveniently estimated using a regression of physical price returns on futures price returns, where the slope estimate represents the desired hedge ratio. It is crucial to predetermine the currency and units of measurement (e.g., USD/t, EUR/t, and cents/bushel) used in the calculations and ensure proper dimension conversion to make sure the hedge ratio accurately reflects the actual "delta" of the physical position in relation to the exchange-traded instrument.
The basis is a key source of "residual" risk for Ukrainian ports. Even if the futures price and the price of a physical commodity are strongly correlated, the result of hedging depends on the stability of the difference between the physical price of the CPT and the corresponding futures quote, adjusted for quality, currency, logistics and time lag. As the execution deadline approaches, the futures price usually approaches the spot price, but at the opening and closing points of the hedge, the basis can be either positive or negative (Figure 2). Thus, for any non-zero value of the basis, the underlying risk remains, which is the main limitation for cross hedging the physical price of CPT using exchange contracts.
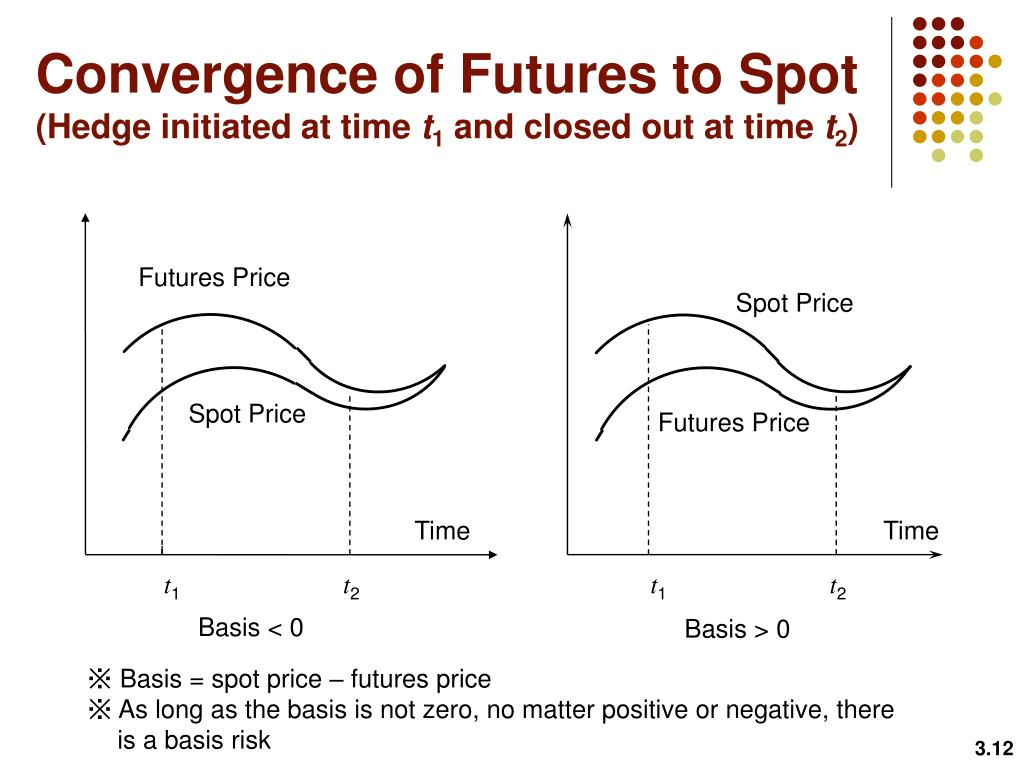
Fig. 2. Convergence of the futures price to the spot price and the underlying hedging risk [7]
In practice, the calculation of the optimal hedge should be carried out in such a way that the model takes into account only those risks that the trader really bears. For the physical price of CPT, this is usually a change in the export or port price, taking into account the quality and typical shipping window. And for futures, it is the most liquid contract with the nearest delivery months or a "rolled" row.
Since our goal is to create an effective hedging mechanism, the quality assessment should not be limited to just one coefficient. A standard measure is the coefficient of variance reduction, which shows how much the variation in profitability of a portfolio consisting of physical and futures positions decreases compared to just a physical position. In addition, it is important to compare the results according to tail-risk criteria (for example, quantile/ES on yields) and operational criteria such as the stability of the coefficient when the valuation window changes, sensitivity to the choice of the futures month, the impact of currency revaluation (USD/EUR) and the effect of transaction costs (commissions, spreads and roll losses). In order for the reader to correctly interpret the results, it is necessary that the methodology describe the exchange specification and the procedure for determining settlement prices. This will provide a technical basis for the comparability of the series [4].
Conclusions
Thus, in order to hedge a physical CPT position using CBOT and MATIF/Euronext futures, it is necessary to ensure full compliance of the data series: currency, units of measurement, contract selection and rolling, and date synchronization. Otherwise, the assessment of the relationship and the hedge parameters will be unreliable. The main limitation of cross hedging is the underlying risk. The CPT Price includes logistical and terminal components that do not always change simultaneously with stock quotes. Therefore, even if there is a stable price link, the hedge cannot eliminate the variation in the result.
The proposed procedure for calculating the hedge coefficient by the criterion of minimum variance and evaluating the effectiveness of reducing portfolio variance allows us to move from an "intuitive" choice of a benchmark to a statistically verifiable solution. In practice, this means that it is necessary to evaluate not only the correlation, but also the stability of the basis and hedging parameters over time. This will help reduce the risk of formal hedging, which will not be able to protect during periods of regime change.
References:
- Black Sea Grain market report [Electronic resource]. – Access mode: https://ukragroconsult.com/wp-content/uploads/2023/03/black-sea-grain-11-1.pdf.
- Carriage Paid To (CPT): What It Means with Example [Electronic resource]. – Access mode: https://edgectp.com/incoterms/carriage-paid-to-cpt-incoterms/.
- Chapter 14. Wheat Futures [Electronic resource]. – Access mode: https://www.cmegroup.com/rulebook/CBOT/II/14/14.pdf.
- Daily settlement prices (DSP) of commodity futures [Electronic resource]. – Access mode: https://live.euronext.com/en/products/commodities/dsp.
- In 2022, the ports of Ukraine handled more than 59 million tons of cargo [Electronic resource]. – Access mode: https://en.usm.media/in-2022-the-ports-of-ukraine-handled-more-than-59-million-tons-of-cargo/.
- OPINION on position limits on MILLING WHEAT No. 2 contracts [Electronic resource]. – Access mode: https://www.esma.europa.eu/sites/default/files/2023-05/ESMA70-155-13072_ESMA_Opinion_Position_Limits_Milling_Wheat_2023.pdf.
- PPT – Hedging Strategies Using Futures PowerPoint Presentation, free download – ID: 2022504 [Electronic resource]. – Access mode: https://www.slideserve.com/loyal/hedging-strategies-using-futures.
Other articles of the issue