

The Evolution of Organizational Structure in a Scaling Construction Firm: From Local Contractor to International Group of Companies
Authors
Altay Aryn
Share
Annotation
This article aims to identify the stages of growth at which a construction firm has to change its organizational structure and to compare these stages with publicly available statistics for Kazakhstan and Uzbekistan for 2015–2025. Drawing on the literature on firm growth, project-based organization, and internationalization, it proposes a model of four thresholds: the number of sites outgrowing what the founder can manage personally, the move to general contracting, the spin-off of a related business into a separate company, and entry into a neighboring market through a subsidiary. In 2025, medium-sized and large organizations made up 4.1% of construction organizations in Kazakhstan but accounted for 38.9% of construction output. Gross outflows of direct investment from Kazakhstan to Uzbekistan across all activities rose from US$2.6 million in 2015 to US$310.0 million in 2025, yet no comparable growth is visible in the construction sector. The statistics are consistent with the model, but the model can be tested only with firm-level data.
Keywords
Authors
Altay Aryn
Share
Of the 10,671 construction organizations in Kazakhstan in 2025, 10,231 were small, with up to 100 employees (Bureau of National Statistics, 2026a). Between 2015 and 2025, real construction output grew 2.7-fold, while the number of organizations rose by 40.5% (Bureau of National Statistics, 2026b, 2026c), so average output per organization nearly doubled. A firm that captures this growth has to restructure when the founder can no longer run every site personally, when it moves into general contracting, and when it begins to operate permanently in a neighboring country.
Stage models describe such restructuring as a sequence of mandatory stages, but an assessment of 104 of these models found no empirical support for them (Levie & Lichtenstein, 2010). A review of scaling research focuses on young entrepreneurial ventures (DeSantola & Gulati, 2017), and studies of project-based organization, including those in construction, examine mainly how the project itself is organized (Hobday, 2000; Meléndez et al., 2026). None of this work traces the path of the construction firm itself, from the founder’s crew to a group of companies with a subsidiary abroad.
This article describes the thresholds at which a growing construction firm has to change its organizational structure and compares them with publicly available statistics for Kazakhstan and Uzbekistan for 2015–2025. It also shows which traces of these thresholds are visible in official statistics and which are not.
Literature review
Stage-of-growth models were the most widely used approach to the growth of entrepreneurial firms from 1962 to 2006. Greiner’s (1972/1997) classic model describes five phases of growth, each of which ends in a management crisis and is largely shaped by the phase before it. Levie and Lichtenstein (2010) found in 104 stage models neither agreement on basic concepts nor empirical support and proposed instead a dynamic states approach, which does not fix the number or order of states in advance. Phelps et al. (2007) likewise rejected the assumption of linear growth and proposed a typology of tipping points common to growing firms.
Using data on French manufacturing firms, Caliendo et al. (2015) showed that firms that substantially expand output add layers of hierarchy and that their growth cannot be explained without this reorganization. According to the review by DeSantola and Gulati (2017), some organizational features persist during scaling, while others change sharply.
Eccles (1981) explained subcontracting by general contractors in terms of task complexity, firm size, and the geographic extent of the market. In his data, the form of administration depended primarily on firm size and on the firm’s role in the production process. Project-based organization adapts flexibly to the project and the client but is weak in routine tasks, economies of scale, and the coordination of resources across projects (Hobday, 2000). The structure of project management also depends on the local environment: in the large projects studied, it tended toward centralization in Peru and was flatter in Chile (Meléndez et al., 2026).
According to the Uppsala model, uncertainty in a new market stems primarily from the firm’s position outside the local network of business relationships, that is, from its outsidership (Johanson & Vahlne, 2009). In China, a contractor’s entry into markets in other regions is more strongly associated with its size than with its ownership type or experience (Xia et al., 2024), while small and medium-sized construction companies usually lack international experience (Jung et al., 2022).
Data and methods
The threshold model was built by synthesizing the literature and was then compared with publicly available statistics. For Kazakhstan, the analysis draws on series from the Bureau of National Statistics (BNS) for 2015–2025 on construction output, volume indices, and the number of organizations (Bureau of National Statistics, 2026b, 2026c); bulletins on construction work for 2024 and 2025 with breakdowns by size class and form of ownership (Bureau of National Statistics, 2025, 2026a); and a table of services exports and imports (Bureau of National Statistics, 2026d). The BNS classifies organizations with up to 100 employees as small, those with 101–250 as medium-sized, and those with more than 250 as large. Direct investment data come from the National Bank of Kazakhstan (National Bank of the Republic of Kazakhstan, 2026), and data on construction in Uzbekistan from the datasets of the National Statistics Committee (National Statistics Committee of the Republic of Uzbekistan, 2025, 2026). All releases used were published no later than September 30, 2026.
The calculations include a chain-linked real output index (2015 = 100), the shares of size classes in the number of organizations and in construction output, average output per organization, and the ratio of average output in medium-sized organizations to that in small ones. The 2023 shares were reconstructed from the year-on-year percentages in the 2024 bulletin, which are calculated at constant prices. The BNS records all work performed under construction contracts without distinguishing general contracting from subcontracting (Bureau of National Statistics, 2026a), so threshold T2 can be observed only indirectly, through a headcount of more than 100 employees. Cost-estimating and technical departments require staff, but a small general contractor that subcontracts extensively will be classified as small, and a large subcontractor as medium-sized or large. The calculations are descriptive, and the article draws no causal conclusions.
Results
Four growth thresholds
The model describes five states of a construction firm and four thresholds between them (Table 1, Figure 1). At each threshold, the existing mode of coordination stops working, and the structure changes abruptly, as when a layer of management is added in Caliendo et al. (2015).
Thresholds T1 and T2 are related to the volume of work and to client requirements. The spin-off of a related business (a concrete batching plant, equipment rental, or a design office) into a separate company at threshold T3 remains a hypothesis of the model, with no direct source in the literature and no trace in the statistics. T4 is related to the fact that construction work is tied to its location; in the model, permanent operations in a neighboring country are conducted through a subsidiary, although a branch is also possible.
Table 1. Growth thresholds of a construction firm
|
Threshold |
Structural response |
Evidence in statistics and literature |
|
T1. More sites than the founder can run personally |
site managers instead of the founder’s supervision |
not visible; growing firms add layers of management (Caliendo et al., 2015) |
|
T2. General contracting |
cost-estimating and technical departments, procurement, occupational health and safety |
indirect: organizations with more than 100 employees made up 4.1% of all organizations and accounted for 38.9% of output in 2025; administration depends on firm size and role (Eccles, 1981) |
|
T3. Related business in a separate company |
group of companies with shared services |
hypothesis: data are recorded by legal entity; no direct source |
|
T4. Neighboring market |
subsidiary; targets and standards set by headquarters |
investment in Uzbekistan across all activities: US$2.6 million in 2015, US$310.0 million in 2025; no growth in the construction series; network position (Johanson & Vahlne, 2009) |
T1–T4, transition thresholds. Source: Compiled by the author from the literature and data from Bureau of National Statistics (2026a) and National Bank of the Republic of Kazakhstan (2026).
In Greiner’s (1972/1997) model, phase changes are triggered by management crises within the growing organization, whereas in the proposed model the thresholds are set by the firm’s role in the contracting chain, the location-bound nature of the work, and the owner’s decisions. T1 precedes T2 because general contracting requires established site management. In the model, T4 follows T2 because a contractor’s entry into new markets is associated with its size (Xia et al., 2024); extending this finding from Chinese regions to foreign markets is the author’s assumption. T3 can be skipped (dashed line in Figure 1), and if output declines, the firm can revert to an earlier state. The model is therefore closer to the dynamic states approach (Levie & Lichtenstein, 2010) than to a sequence of mandatory stages.
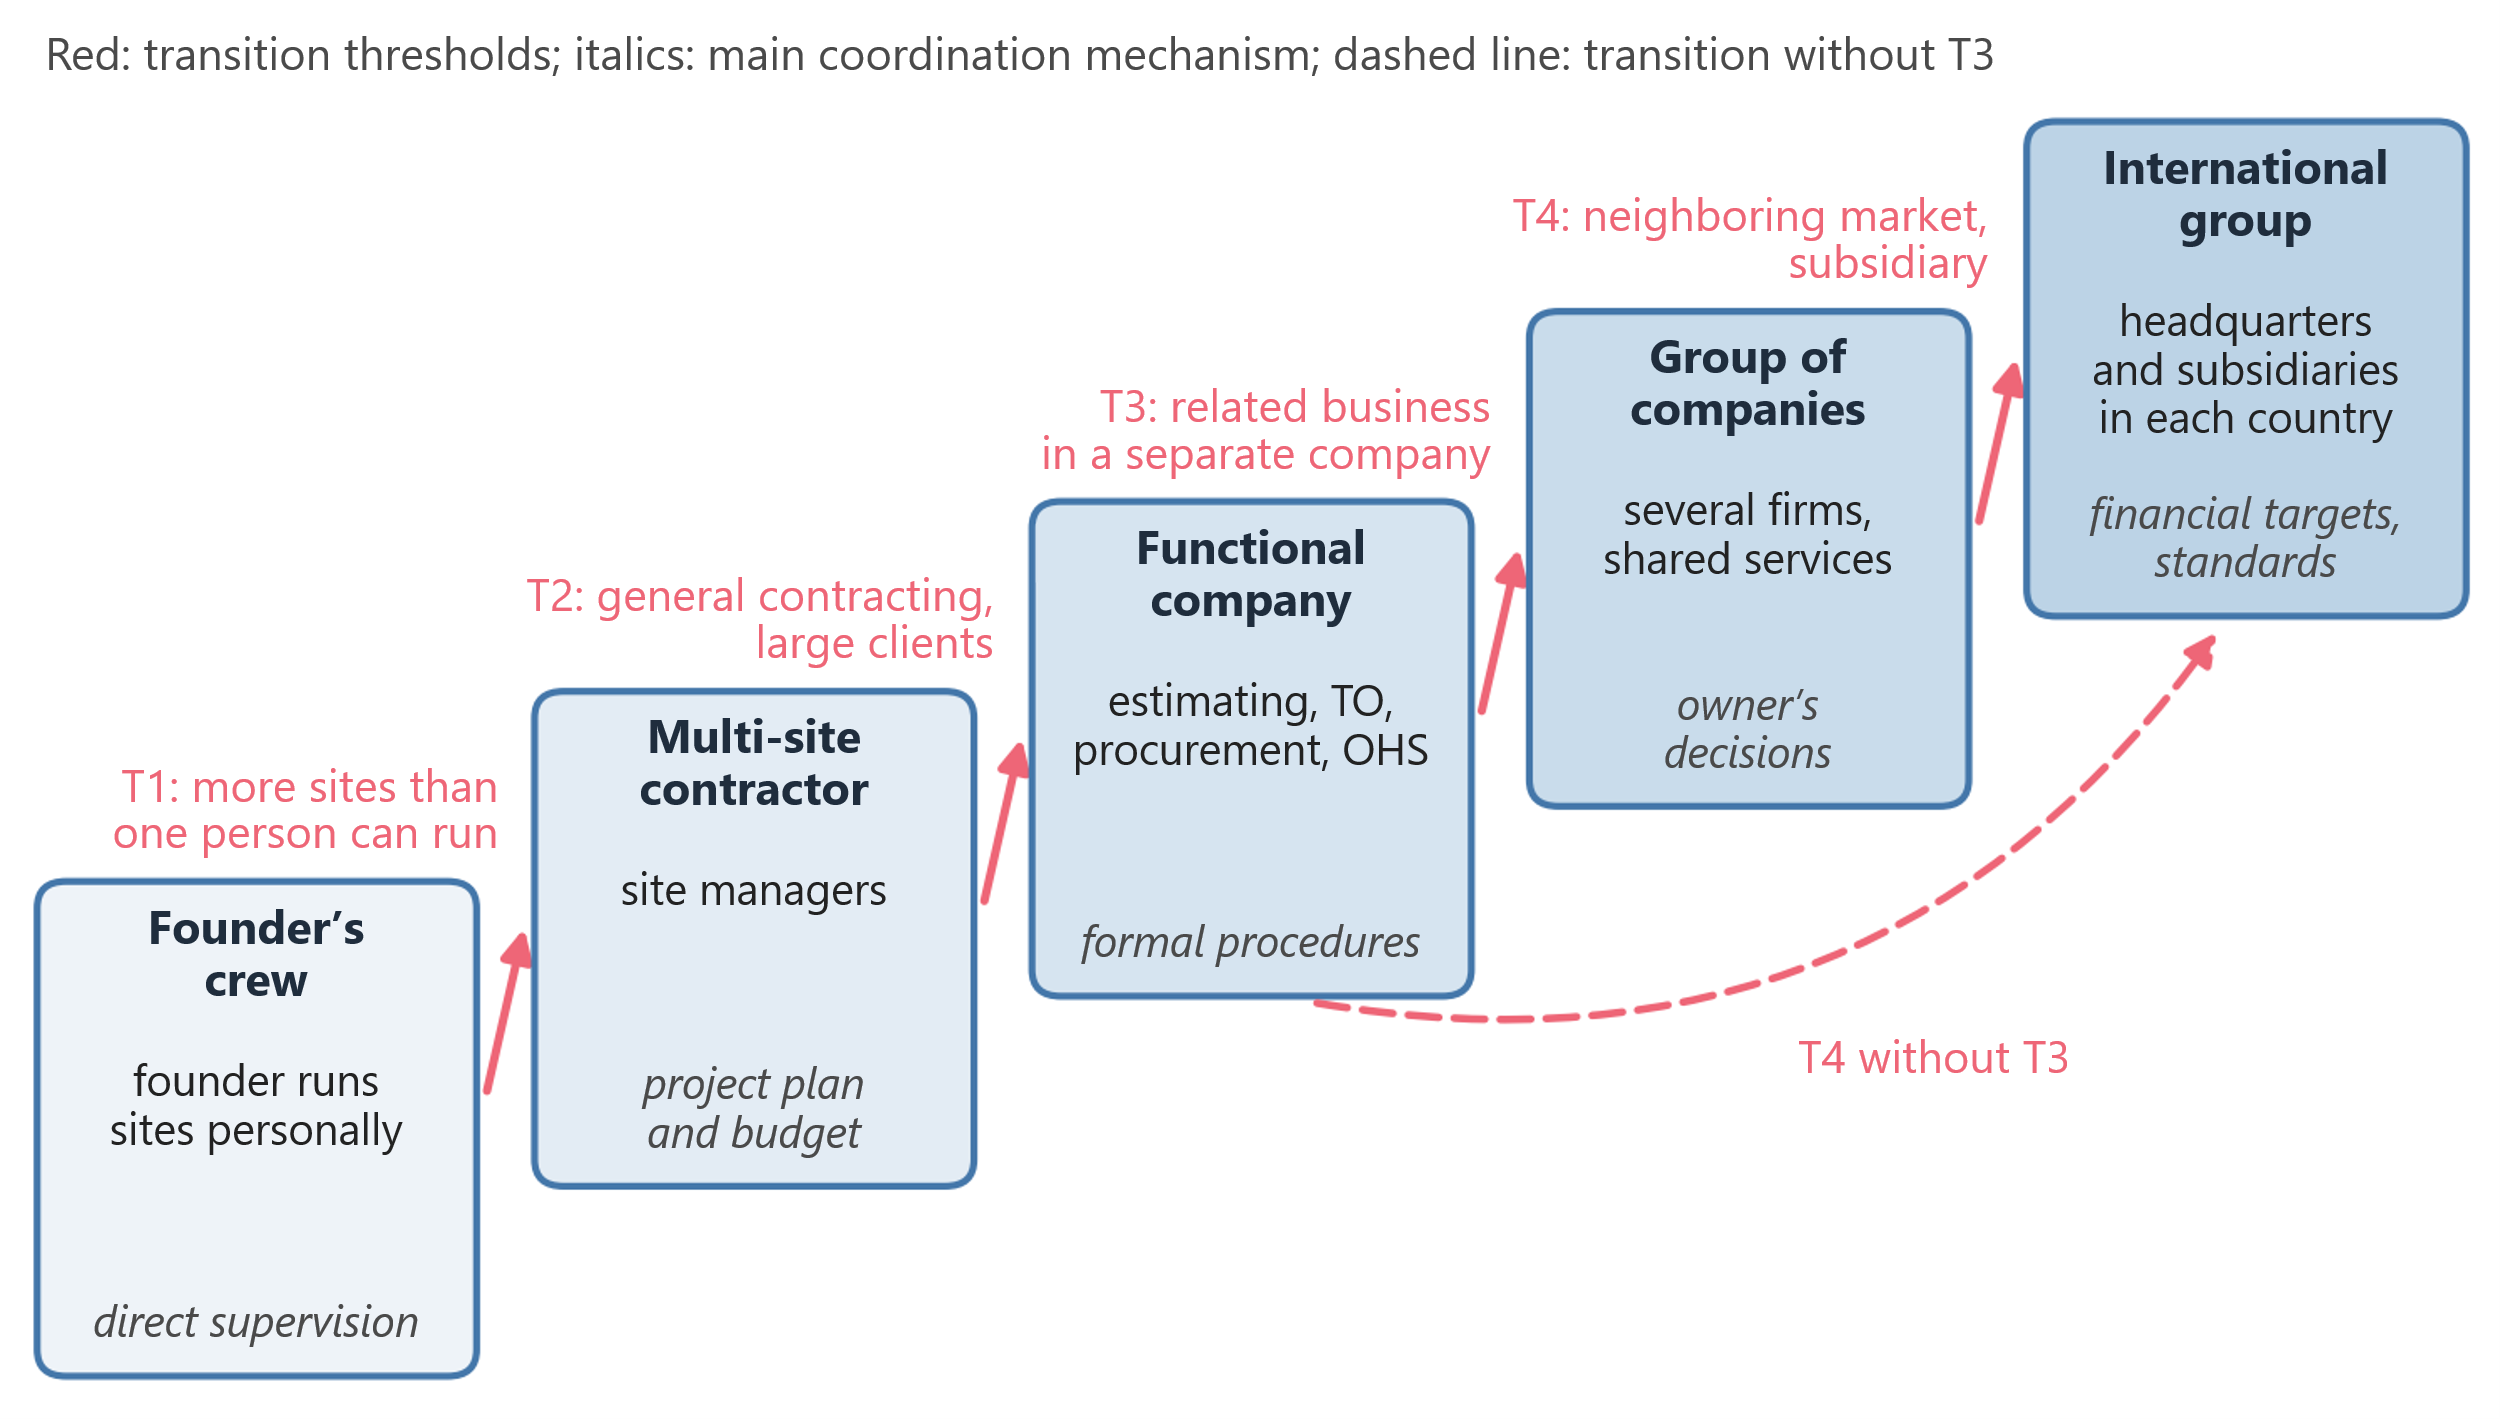
T1–T4, transition thresholds; TO, technical office; OHS, occupational health and safety. Transitions are reversible.
Figure 1. States of a construction firm and the thresholds between them (Source: Compiled by the author)
Kazakhstan: size class as an indirect marker of the second threshold
In 2025, small organizations made up 95.9% of construction organizations in Kazakhstan and accounted for 61.1% of construction output, while 295 medium-sized (2.8%) and 145 large (1.4%) organizations together accounted for 38.9% (Figure 2a). Average output per medium-sized organization was 8.01 billion tenge, compared with 0.65 billion per small organization, or 12.4 times less (Table 2). This ratio is partly built into the class boundaries, since a medium-sized organization has more employees than a small one.
Table 2. Construction organizations in Kazakhstan by size class, 2024–2025
|
Size class |
Number, 2024 |
Number, 2025 |
Output, 2024 |
Output, 2025 |
Per org., 2024 |
Per org., 2025 |
2025, % of 2024 |
|
Small |
9,410 |
10,231 |
5,009.5 |
6,631.9 |
0.53 |
0.65 |
129.9 |
|
Medium-sized |
289 |
295 |
1,815.7 |
2,364.0 |
6.28 |
8.01 |
127.8 |
|
Large |
159 |
145 |
2,236.9 |
1,851.1 |
14.07 |
12.77 |
81.2 |
|
Total |
9,858 |
10,671 |
9,062.1 |
10,847.0 |
0.92 |
1.02 |
117.5 |
Output and output per organization are in billions of tenge at current prices; the last column shows 2025 output as a percentage of 2024 output at constant prices, as reported in the bulletin. Source: Bureau of National Statistics (2025, 2026a); author’s calculations.
Between 2023 and 2025, the share of large organizations in construction output fell from 31.1% to 17.1%, while the share of medium-sized organizations rose from 17.9% to 21.8% and that of small organizations from 51.0% to 61.1% (Figure 2b). Class membership changes over time (a firm that hires its 101st employee moves into the medium-sized class), so these shifts cannot be read as the history of the same firms. Foreign-owned organizations (4.7% of the total number) accounted for 11.4% of construction output in 2025, and work by nonresidents, recorded as imports of construction services, amounted to US$618.8 million (Bureau of National Statistics, 2026d).
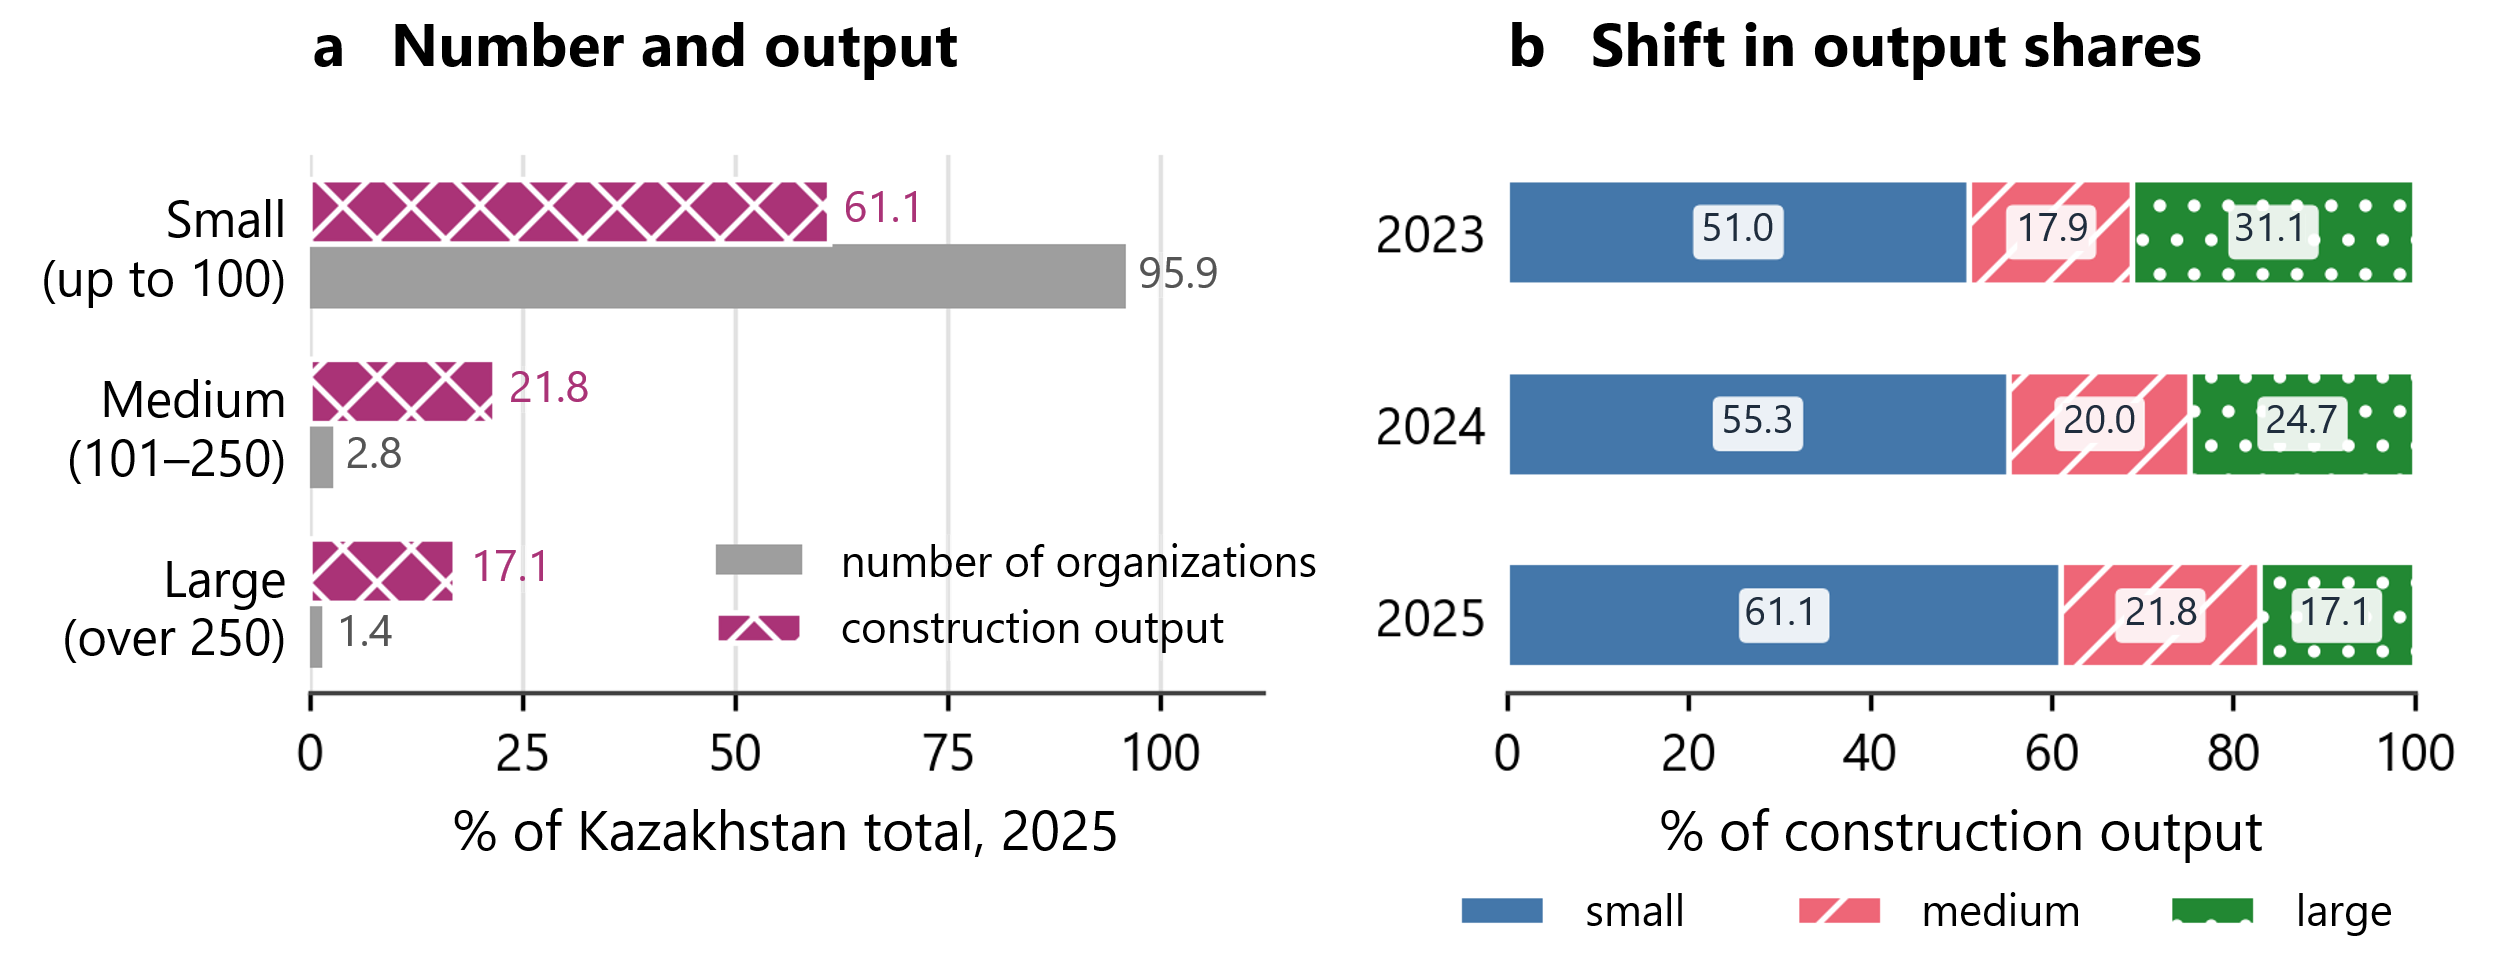
Small, up to 100 employees; medium-sized, 101–250; large, more than 250. The 2023 shares were estimated from the year-on-year percentages in the 2024 bulletin (at constant prices)
Figure 2. Construction organizations in Kazakhstan by size class: shares in the number of organizations and in construction output in 2025 (a) and shares in construction output in 2023–2025 (b), % (Source: Bureau of National Statistics (2025, 2026a); author’s calculations)
The neighboring market: Uzbekistan
Between 2015 and 2024, construction in Uzbekistan grew by 134.7% in real terms (National Statistics Committee of the Republic of Uzbekistan, 2025), and construction in Kazakhstan by 131.1% (Figure 3a). The coverage of the two series differs: Uzbekistan’s construction output includes an estimate of individual housing built by households, whereas Kazakhstan’s covers only work performed under construction contracts. Small businesses accounted for 75.4% of construction work in Uzbekistan in 2024 and 73.6% in 2025 (National Statistics Committee of the Republic of Uzbekistan, 2026), but because each country applies its own criteria for small business, this share is only roughly comparable with Kazakhstan.
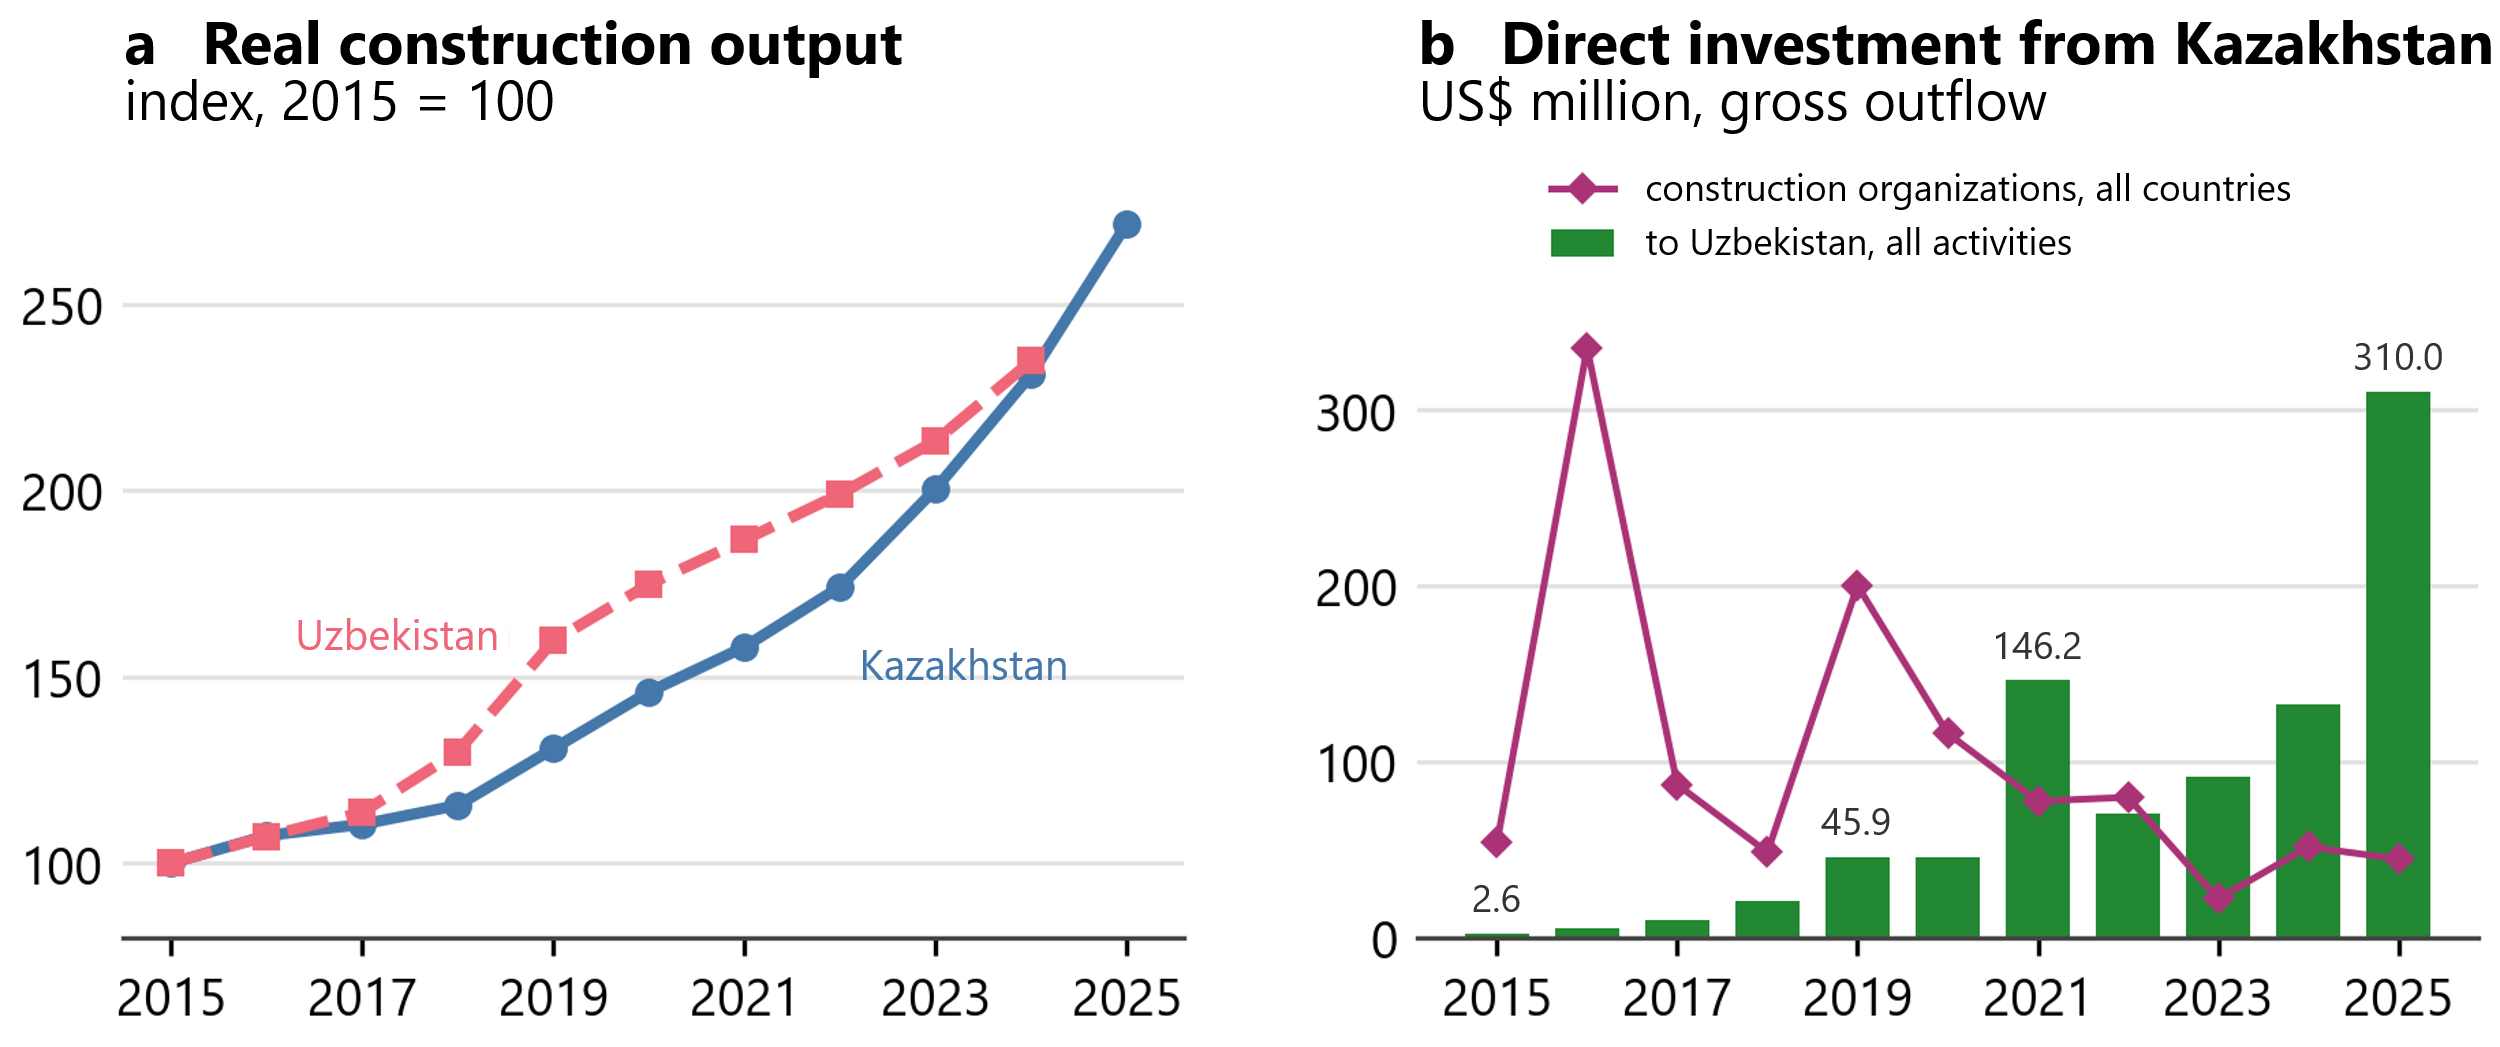
(a) chain-linked index based on volume indices, 2015 = 100; data for Uzbekistan through 2024, including estimated individual housing construction; (b) US$ million.
Figure 3. Real construction output in Kazakhstan and Uzbekistan (a) and gross outflow of direct investment from Kazakhstan (b), 2015–2025 (Source: Bureau of National Statistics (2026b); National Statistics Committee of the Republic of Uzbekistan (2025); National Bank of the Republic of Kazakhstan (2026); author’s calculations)
Gross outflows of direct investment from Kazakhstan to Uzbekistan across all activities rose from US$2.6 million in 2015 to US$310.0 million in 2025, or to 12.0% of total outflows (Figure 3b). This flow is not broken down by industry, while direct investment abroad by Kazakhstan’s construction organizations, across all countries, fell from US$786.8 million in 2016–2020 to US$275.8 million in 2021–2025 (National Bank of the Republic of Kazakhstan, 2026). Exports of construction services over the same periods amounted to US$167.4 million and US$255.9 million, and to US$34.1 million in 2025 (Bureau of National Statistics, 2026d). The statistics therefore neither confirm nor refute threshold T4 for construction firms.
Discussion
If a headcount of more than 100 employees is taken as the marker of the second threshold, few organizations cross it, yet they account for almost 40% of construction output. For many firms, staying small is probably a rational choice, since general contractors make extensive use of subcontracting (Eccles, 1981). Such a distribution is compatible with both Greiner’s (1972/1997) model and the dynamic states approach.
Project-based organization is poor at coordinating resources across projects (Hobday, 2000), and the shared services of the functional company and of the group respond to this weakness. Through a subsidiary, a firm can enter the local network of relationships whose absence Johanson and Vahlne (2009) regard as the main source of uncertainty in a new market (the author’s assumption).
The main limitation of these findings is the lack of employment data by size class; without such data, the 12.4-fold gap cannot be decomposed into differences in headcount and differences in productivity. T2 is measured only indirectly, and T3 is not visible in the statistics because groups of companies are recorded by legal entity. The Uzbek series are subject to revision; the analysis uses the versions published before October 2026.
Conclusion
The proposed model describes four thresholds at which the organizational structure of a construction firm is rebuilt. It posits that these thresholds are set by the firm’s role in the contracting chain, the location-bound nature of the work, and the owner’s decisions; that T3 can be skipped; and that transitions are reversible. For owners of contracting firms, the model identifies the functions they will need after each threshold; for statistical agencies, it points to the missing data: employment by size class and information on groups of companies. Whether contractors add cost-estimating and technical departments once they exceed 100 employees can be tested with firm-level panel data.
References:
Bureau of National Statistics. (2025). On construction works and commissioning of facilities in the Republic of Kazakhstan, 2024 [Statistical bulletin]. Agency for Strategic Planning and Reforms of the Republic of Kazakhstan. https://stat.gov.kz/api/iblock/element/347232/file/ru/ (In Russ.)
Bureau of National Statistics. (2026a). On construction works and commissioning of facilities in the Republic of Kazakhstan, 2025 [Statistical bulletin]. Agency for Strategic Planning and Reforms of the Republic of Kazakhstan. https://stat.gov.kz/api/iblock/element/347234/file/ru/ (In Russ.)
Bureau of National Statistics. (2026b). Main indicators of construction activity, 1990–2025 [Data set]. Agency for Strategic Planning and Reforms of the Republic of Kazakhstan. https://stat.gov.kz/api/iblock/element/4276/file/ru/ (In Russ.)
Bureau of National Statistics. (2026c). Number of enterprises and organizations engaged in construction, 2003–2025 [Data set]. Agency for Strategic Planning and Reforms of the Republic of Kazakhstan. https://stat.gov.kz/api/iblock/element/4295/file/ru/ (In Russ.)
Bureau of National Statistics. (2026d). Exports and imports of services of the Republic of Kazakhstan (National Bank data), 2000–2025 [Data set]. Agency for Strategic Planning and Reforms of the Republic of Kazakhstan. https://stat.gov.kz/api/iblock/element/4100/file/ru/ (In Russ.)
Caliendo, L., Monte, F., & Rossi-Hansberg, E. (2015). The anatomy of French production hierarchies. Journal of Political Economy, 123(4), 809–852. https://doi.org/10.1086/681641
DeSantola, A., & Gulati, R. (2017). Scaling: Organizing and growth in entrepreneurial ventures. Academy of Management Annals, 11(2), 640–668. https://doi.org/10.5465/annals.2015.0125
Eccles, R. G. (1981). Bureaucratic versus craft administration: The relationship of market structure to the construction firm. Administrative Science Quarterly, 26(3), 449–469. https://doi.org/10.2307/2392517
Greiner, L. E. (1997). Evolution and revolution as organizations grow. Family Business Review, 10(4), 397–409. https://doi.org/10.1111/j.1741-6248.1997.00397.x (Original work published 1972)
Hobday, M. (2000). The project-based organisation: An ideal form for managing complex products and systems? Research Policy, 29(7–8), 871–893. https://doi.org/10.1016/S0048-7333(00)00110-4
Johanson, J., & Vahlne, J.-E. (2009). The Uppsala internationalization process model revisited: From liability of foreignness to liability of outsidership. Journal of International Business Studies, 40(9), 1411–1431. https://doi.org/10.1057/jibs.2009.24
Jung, W., Han, S. H., Park, C., Lee, C., & Baek, S. (2022). Three-phased risk-management benchmark for internationalization of small and medium-sized construction companies. KSCE Journal of Civil Engineering, 26(3), 1024–1039. https://doi.org/10.1007/s12205-021-1573-9
Levie, J., & Lichtenstein, B. B. (2010). A terminal assessment of stages theory: Introducing a dynamic states approach to entrepreneurship. Entrepreneurship Theory and Practice, 34(2), 317–350. https://doi.org/10.1111/j.1540-6520.2010.00377.x
Meléndez, W., Melgar, M., Pérez, K., Zegarra, O., & Garcés, G. (2026). The complexity of organizational structures in the construction industry: Comparative analysis of building projects. Discover Civil Engineering, 3(1), Article 85. https://doi.org/10.1007/s44290-026-00478-y
National Bank of the Republic of Kazakhstan. (2026). Gross outflow of direct investment abroad by Kazakh direct investors by residents' economic activity and by country, 2005 – Q2 2026 [Data set]. https://nationalbank.kz/ru/news/pryamye-investicii-po-napravleniyu-vlozheniya (In Russ.)
National Statistics Committee of the Republic of Uzbekistan. (2025). Growth rate of construction works (indicator 1.04.02.0003) [Data set; version of December 30, 2025]. https://web.archive.org/web/20260515111252/https://api.siat.stat.uz/media/uploads/sdmx/sdmx_data_2404.json
National Statistics Committee of the Republic of Uzbekistan. (2026). Share of small businesses in the total volume of construction work (indicator 1.10.02.0011) [Data set; version of April 28, 2026]. https://web.archive.org/web/20260513200742/https://api.siat.stat.uz/media/uploads/sdmx/sdmx_data_357.json
Phelps, R., Adams, R., & Bessant, J. (2007). Life cycles of growing organizations: A review with implications for knowledge and learning. International Journal of Management Reviews, 9(1), 1–30. https://doi.org/10.1111/j.1468-2370.2007.00200.x
Xia, C., Wang, G., Cao, D., & Hu, Y. (2024). Influence of organization environment on contractor's inter-regional market entry practice in China: An industry-level approach based on Bayesian logistic regression model. Construction Management and Economics, 42(7), 640–655. https://doi.org/10.1080/01446193.2024.2309890
Other articles of the issue