

BLENDING WITHOUT BASE OIL: IMPORT SUBSTITUTION IN KAZAKHSTAN’S LUBRICANT SUPPLY, 2015–2025
Authors
Bolat Tenizbayev
Share
Annotation
Kazakhstan opened a modern lubricant blending plant in 2010 and a larger one in 2019, yet most of the oil in its engines and gearboxes is still imported. This study asks whether domestic blending has replaced imports or moved the dependence upstream, to base oils. UN production data and ten-digit national trade statistics for 2015–2025 are used to decompose the change in output by the Chenery method, with re-exports estimated from unit values. Without an implausible value for 2016, output rose from 20.0 thousand tonnes a year in 2015–2018 to 45.8 thousand tonnes in 2021–2024, while imports rose by 55.0 thousand tonnes. The base years were a trough, marked by the oil-price slump and devaluation of 2015 and by a ban on Russian base-oil supplies from January 2014 to January 2019. With re-exports so estimated, recovery was led by exports, which explain 16.3–18.9 of the 25.8 thousand tonnes added; the import-substitution component is −0.9 to +5.3 thousand tonnes and changes sign across periods. Domestic plants met 10–14% of home use in 2024. Imports under the heading that likely carries most base oils rose from 12.8 to 47.9 thousand tonnes in 2015–2024, 83% of them from Russia in 2024. Raising self-sufficiency would need domestic base oil, from refining or re-refining; whether either can compete with Russian supply is left open.
Keywords
Authors
Bolat Tenizbayev
Share
Introduction
In June 2010 a lubricant blending plant for 70,000 tonnes a year opened in Shymkent. Until then Kazakhstan had imported all its lubricants, and the new plant also ran on imported base oils (Kamchev, 2010). Lukoil added a 100,000-tonne plant near Almaty in 2019 (Kamchev, 2019b), and another plant was due in 2026 (Akhmetova, 2026). On paper, the country can now blend about as much oil as it consumes.
Whether this capacity has replaced imports is a separate question. The current Program for the development of in-country value counts finished oils among the largest petrochemical imports (Government of the Republic of Kazakhstan, 2022). Studies of import substitution in Kazakhstan work at the level of the whole economy (Aubakirova et al., 2023, 2025), and the technical literature asks how base oils could be made at home (Karabassova et al., 2025). We found no study in OpenAlex or Crossref that decomposes the growth of Kazakh lubricant output by source.
This matters because blending is the last and least demanding stage of the chain. A finished lubricant is mostly base oil with an additive package, so a country can blend at home and still import most of what it blends. We combine ten-digit trade data with production statistics and decompose the change in output in the manner of Chenery. Output grew, mostly for export, and the dependence moved to base oils.
Industrial policy and the lubricant chain
As a development strategy, import substitution had a short reign: within about fifteen years its results had disappointed even its cautious early advocates (Irwin, 2021). The recent, more favorable literature on industrial policy rests on better causal evidence and stresses measurement and economic structure (Juhász et al., 2024); for a product chain, we read this as asking which stage was substituted.
Kazakhstan’s economy still depends on extraction. Manufacturing holds a small share and joins global value chains slowly (Aubakirova et al., 2025). The Program for 2022–2026 plans six petrochemical products, from polypropylene to butadiene, but not base oils (Government of the Republic of Kazakhstan, 2022).
Base oils are the hard part. They need refinery units. In 2014 the country made none (Kamchev, 2014b), and a Group III plant planned in Shymkent had been postponed repeatedly since 2011 (Kamchev, 2016). Tests on vacuum gas oil from the Atyrau refinery show that catalytic hydrodewaxing can give base oils with a viscosity index of 136, against 83–86 after dewaxing (Karabassova et al., 2025). Re-refining used oil is the other route; countries differ in whether they re-refine it or burn it as fuel (Cabrera-Escobar et al., 2025).
Trade policy shaped the chain no less. In January 2014 Kazakhstan and Russia agreed a ban on Russian petrochemical supplies, base oils included, later extended until January 2019. Kazakhstan in turn banned exports of base oils and lubricants beyond the customs union with Russia and Belarus from mid-2014, and a six-month decree effective in July banned exports of finished oils (Kamchev, 2014a, 2014b). We found no record of when these bans ended. Before the import ban Russia had shipped about 85,000 tonnes of base oil a year to Kazakhstan, and Hill said that half of the 50,000 tonnes it made in 2013 was meant for export (Kamchev, 2014b).
Data and methods
Production comes from the Energy Statistics Database (United Nations Statistics Division [UNSD], 2025), commodity “lubricants”, 2015–2024, and imports and exports from tables of the Bureau of National Statistics (2026) by ten-digit code of the EAEU Commodity Nomenclature and partner, 2015–2025, both in releases up to 27 July 2026. Shares, unit values and decomposition terms are the author’s calculations from these data. Quantities are in thousand tonnes unless stated.
HS subheading 2710.19 also contains fuels such as kerosene and gas oil, so we sum the ten-digit codes 2710 19 710 0 to 2710 19 980 0 (imports M, exports X). Over 2021–2024 these imports sum to 717.4 thousand tonnes against 712.2 in the UNSD balance, although single years differ by up to 22.
The heading 2710 19 980 0, “other lubricating oils and other oils”, likely carries most base oils but also holds greases and other products. With codes 2710 19 710 0 and 2710 19 750 0, oils for specific processes and for chemical transformation, it forms the potential blending input (imports Min, exports Xin). Apparent consumption is measured gross, D = Q + M − X, where Q is output, and net, Dfin = Q + (M − Min) − (X − Xin). The first double counts imported base oil blended at home; the second omits oil from that heading used directly. The ratio Q/D is not used. Once much output is exported, it overstates the share of home use met at home.
The decomposition follows Chenery’s demand-side method (Tregenna, 2012; Nas et al., 2023). Output is Q = uD + Xd, where Xd is exports of domestic origin and u = (Q − Xd)/D is the share of home use met by home output. Between a base period 0 and an end period 1, the change in output splits as in (1):
ΔQ=u0ΔD+u1u0D1+ΔXd (1)
where the first term is domestic demand expansion, the second import substitution and the third export expansion.
Re-exports are not recorded. Our central rule treats an export flow of a code to a partner as a re-export when its unit value exceeds that year’s import unit value of the code. Otherwise, including codes not imported that year, the flow counts as domestic output: a blend made from cheaper imported base oil is unlikely to sell above the average price of finished imports. The rule errs both ways: with exports valued free on board and imports with freight and insurance, a re-export sold at a thin margin counts as domestic, and a premium domestic blend counts as a re-export. Two bounds bracket these errors: all exports are domestic, or none is (Xd = 0).
The main comparison is between averages for 2015–2018 without 2016 and for 2021–2024. Output recorded for 2016, 53.3 thousand tonnes, is five times that of 2015, although input imports fell to 6.0. Hill, then one of two producers, made 8.9 thousand tonnes in 2015, close to the UNSD total of 10.1 and down from 22.5 in 2014 as the oil-price crash cut demand (Kamchev, 2016). The base years thus fall in a trough, during an economic slump and the ban on Russian base oil, and part of the measured change is recovery. UNSD stock changes, available from 2019, sum to 0.4 thousand tonnes over 2021–2024, so averaging hides no stockbuilding in the end period. Robustness checks use two other windows and drop each year in turn.
Results
Recorded output rose from an average of 20.0 thousand tonnes in 2015–2018 (without 2016) to 45.8 in 2021–2024, with a peak of 68.2 in 2022 (Figure 1). Against the 170 thousand tonnes of the two largest plants, utilization was at most 28% on average in 2020–2024 and 20% in 2024. Smaller blenders also exist, so these are upper bounds. Imports rose by 55.0 thousand tonnes, about twice the increase in output, and imports net of the input codes by 21.7. Exports, 0.1–1.8 thousand tonnes a year in 2015–2018, peaked at 31.9 in 2022 and were 25.7 in 2024. In 2023 and 2024 input imports exceeded recorded output by 47% and 41%: either part of that heading is used directly, or output is under-recorded.
Figure 1. Kazakhstan’s lubricant balance and home use met at home, 2015–2025
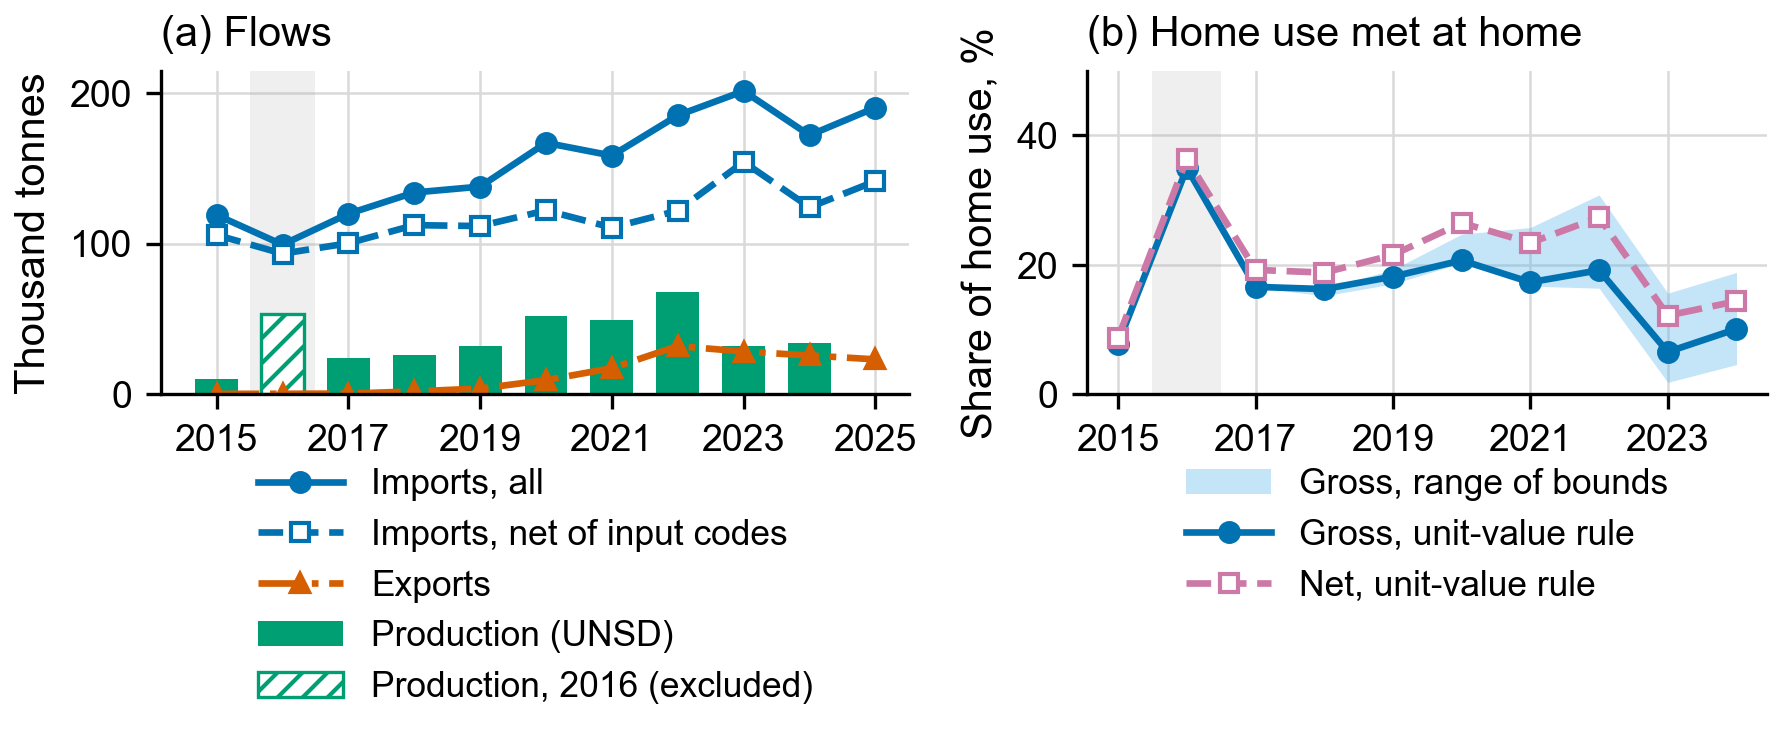
Q, production; M, imports; X, exports; Xd, domestic exports. Panel (b) shows u = (Q − Xd)/D under the rule and bounds of Data and Methods; gross: D = Q + M − X; net: input codes 2710 19 980 0, 710 0 and 750 0 removed from M and X. Shaded: 2016, shown but excluded from the main comparison. Production for 2025 is not yet published. Source: UNSD (2025); Bureau of National Statistics (2026); author’s calculations.
The composition of imports changed more than their level (Figure 2). Motor oil imports stayed at 65–92 thousand tonnes a year, apart from 113.6 in 2023, while imports under the input heading rose from 12.8 thousand tonnes in 2015 to 47.9 in 2024. Despite the base-oil ban, Russia supplied 51% of the heading in 2015, 6.6 thousand tonnes at 525 dollars a tonne, and 35% in 2016. The data do not show why. Russia’s share of the heading fell below 5% only in 2017–2018 and reached 83% in 2024. Its supplies rose from 8.6 thousand tonnes in 2019 to 34.6 in 2020, after the scheduled end of the ban and in the first full year of Lukoil’s plant (Kamchev, 2019b). Over 2015–2024 its share fell from 66% to 40% for motor oil and from 63% to 56% for all lubricating oils. Additive imports (HS 3811 21 and 3811 29) tripled, to 2.4 thousand tonnes in 2024.
Figure 2. Imports of lubricating oils by ten-digit code, 2015–2025
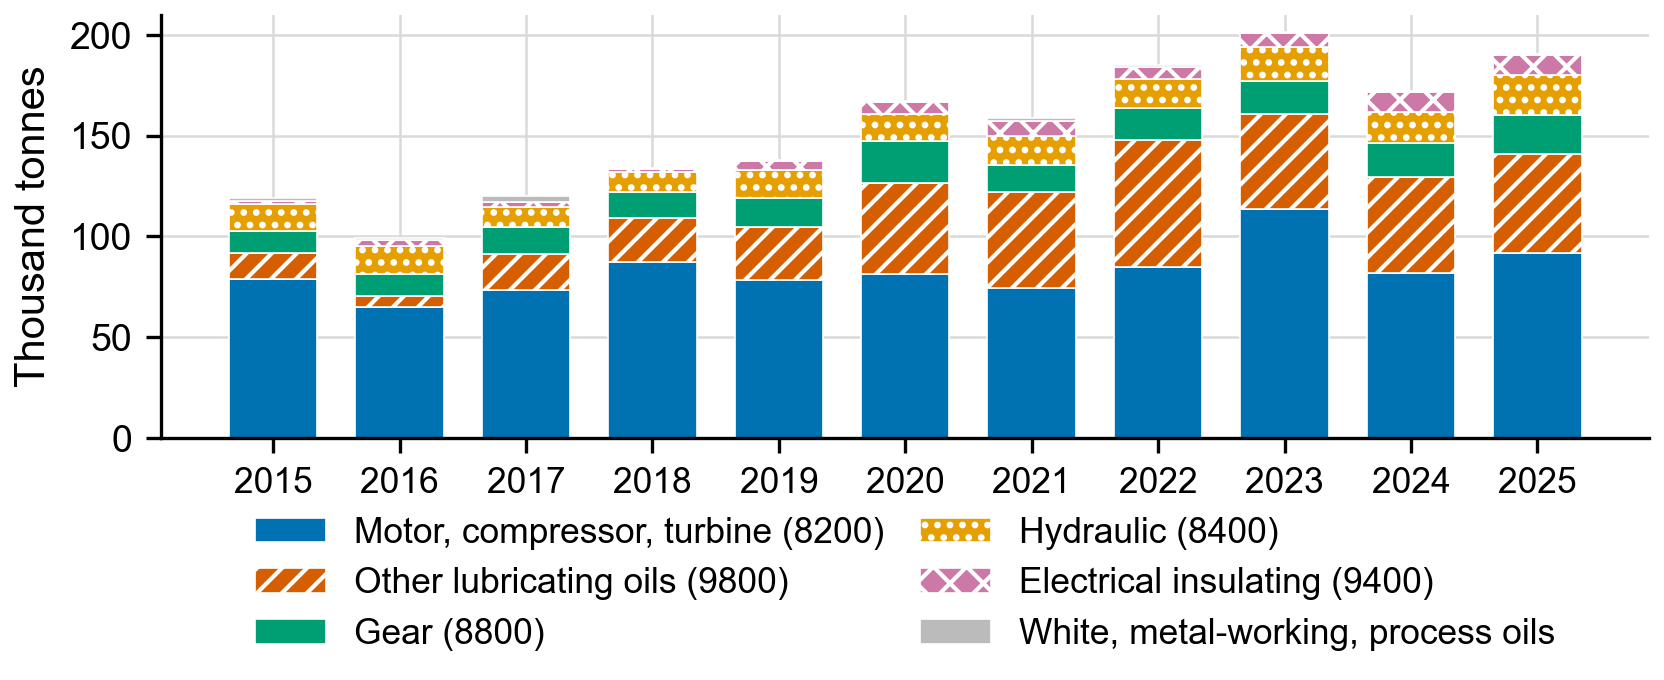
Codes are the last four digits of 2710 19 xxx 0 in the EAEU Commodity Nomenclature; the grey group is 8600, 9200, 7100 and 7500. Source: Bureau of National Statistics (2026).
Figure 3. Unit values of lubricant imports and exports, 2015–2025
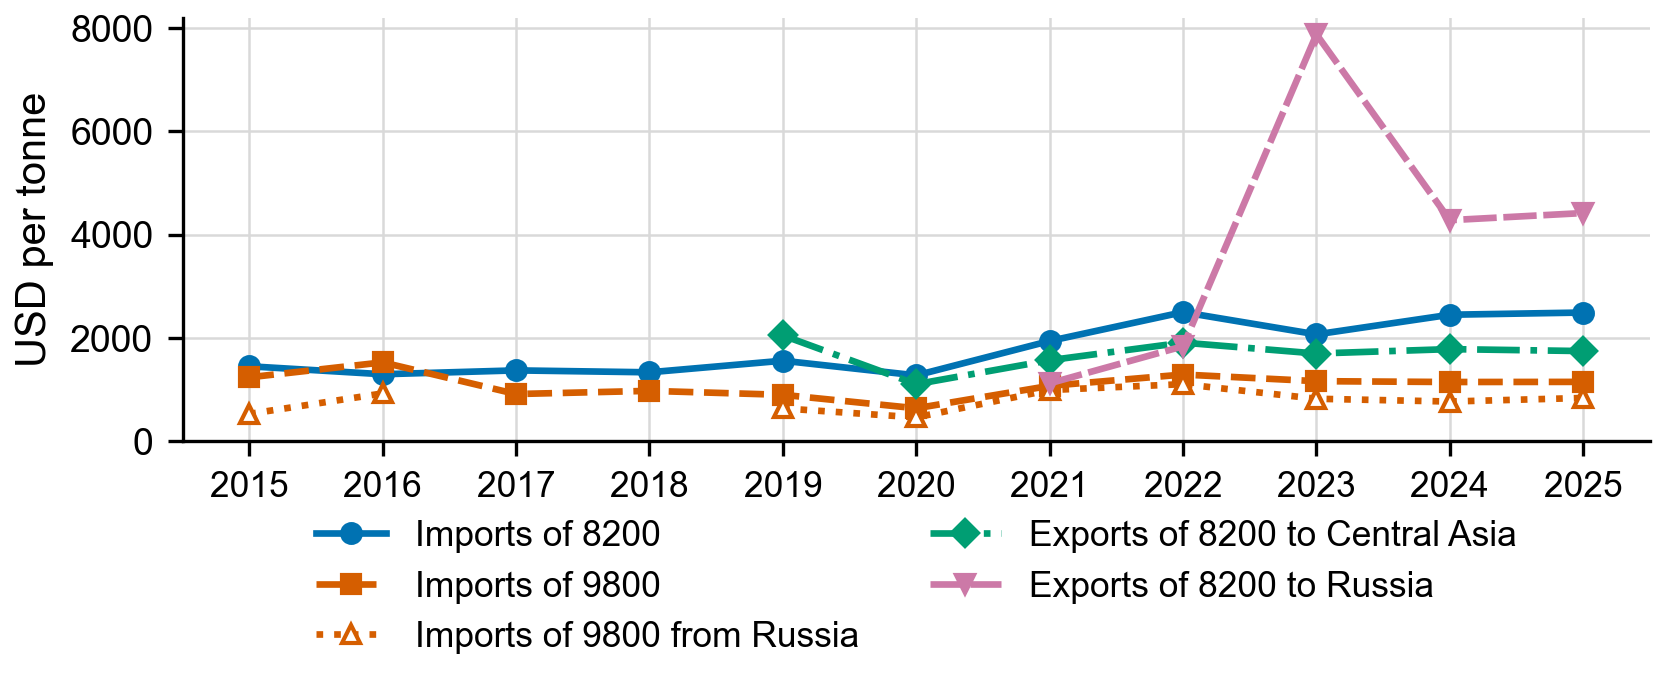
8200, motor, compressor and turbine oils (2710 19 820 0); 9800, other lubricating oils (2710 19 980 0). Customs value per net tonne, current US dollars; imports include freight and insurance, exports are valued free on board. Years in which a flow was below 1 thousand tonnes are left blank. Source: Bureau of National Statistics (2026); author’s calculations.
Prices separate the two kinds of imports (Figure 3). In 2024 a tonne of imported motor oil cost 2,446 US dollars, a tonne under the input heading 1,143, and one from Russia 764. Motor oils sent to Central Asia, 9.1 thousand tonnes in 2024, sold at 1,780 dollars a tonne, below the import price. Exports to Russia jumped from 0.2 thousand tonnes in 2020 to 20.5 in 2022. That year 16.1 thousand tonnes of motor oil went there at 1,835 dollars a tonne, below the average import value of 2,496 and the 3,108 paid for motor oil from elsewhere, so the rule counts them as domestic. Later shipments, at 7,878 and 4,278 dollars a tonne in 2023 and 2024, count as re-exports. By the rule, re-exports made up 19% of exports in 2022 and 39% in 2024.
Under the unit-value rule, exports explain 18.9 of the 25.8 thousand tonnes of extra output on the gross measure and 16.3 on the net one, and domestic demand 4.2–7.7 (Table 1). The import-substitution term is −0.9 and +5.3 thousand tonnes, and across the other windows and with one year dropped it runs from −11.9 to +9.1, changing sign; across the bounds, from −6.7 to +21.6. The share of home use met at home was flat on the gross measure, 13.8% and 13.4% in the two periods, and rose on the net one, from 15.8% to 19.3%. In 2023 and 2024 both fell below their base levels, to 10.1% and 14.4% in 2024 (Figure 1).
Table 1. Chenery decomposition of the change in lubricant output between 2015–2018 (without 2016) and 2021–2024, thousand tonnes
|
Variant |
Demand expansion |
Import substitution |
Export expansion |
IS, other windows |
IS, one year dropped |
|
gross; all |
7.5 |
−6.7 |
25.0 |
−16.8; −17.9 |
−11.5 to −1.0 |
|
gross; unit value |
7.7 |
−0.9 |
18.9 |
−9.8; −11.9 |
−6.0 to 3.9 |
|
gross; none |
7.8 |
18.1 |
0.0 |
9.3; 7.1 |
11.6 to 22.9 |
|
net; all |
4.1 |
0.7 |
21.1 |
−8.3; −8.2 |
−4.0 to 5.5 |
|
net; unit value |
4.2 |
5.3 |
16.3 |
−2.8; −3.4 |
0.5 to 9.1 |
|
net; none |
4.2 |
21.6 |
0.0 |
13.1; 12.9 |
14.6 to 27.0 |
Variant: measure (gross, or net of the input codes 2710 19 980 0, 710 0 and 750 0); exports counted as domestic (all, by the unit-value rule, or none). Output change 25.8; components may not add up because of rounding. IS, import substitution. Other windows: 2017–2019 against 2022–2024 (output change 17.4) and 2015–2018 with 2016 against 2021–2024 (17.5). One year dropped: range of IS when each of the seven years is left out in turn. Source: author’s calculations based on UNSD (2025) and Bureau of National Statistics (2026).
Discussion
The growth is partly a recovery. Output in 2021–2024, 45.8 thousand tonnes a year, stayed below the 50 thousand tonnes Hill alone reported for 2013 (Kamchev, 2014b), a company figure for a year our data do not cover. The chain was localized from the end. Blending moved to Kazakhstan and created exports to Central Asia priced below imports, while the inputs, as before the ban, come mostly from Russia. Between 764 dollars for a tonne of the input heading from Russia and 2,446 for a tonne of imported motor oil lies the margin from which domestic blenders also pay for additives and packaging. A mining company or a farm buying a Kazakh-blended engine oil still depends on Russian refinery runs and imported additives.
As in decomposition studies of South Africa since 2000 and of Turkey (Tregenna, 2012; Nas et al., 2023), import substitution was not the source of growth. Unlike them, growth here was led by exports. Exports explain 16.3–18.9 of the 25.8 thousand tonnes added under the unit-value rule and 21.1–25.0 if all are domestic, at least partly a rebound from the trough of the base years; with far more re-exports than the rule estimates, import substitution would lead. That capacity built is not substitution achieved is our inference, in line with Juhász et al. (2024) on measurement.
Hill’s re-refinery turns up to 30 thousand tonnes of waste oil a year into base oil, but only for the company’s own greases (Kamchev, 2019a). Otherwise the capacity added so far is in blending. VOLTREX, a blending plant of up to 50 thousand tonnes a year with a used-oil regeneration unit, was due in the second quarter of 2026 (Akhmetova, 2026). We found no report of its commissioning as of October 2026. The 2018 waste-oil standard aimed at full-cycle processing of at least 49% of lubricants consumed (Kamchev, 2019a), yet Kazakhstan exported 5.1 thousand tonnes of waste oils (2710 91 and 2710 99) in 2024 and imported none.
Four limitations matter. The UNSD output series jumps in 2016 and 2023 and cannot be checked against plant data; the input heading mixes base oils with other products; re-exports are inferred from prices, while the structure of exports to Russia changed after 2022 (Moldashev, 2023). The base-period trough reflects both the economic slump and the trade bans, which our data, starting in 2015, cannot separate. As a cross-check, Hill’s 60% estimate of the import share (Kamchev, 2019a) is below the 82–85% in the 2018 statistics, probably because definitions differ.
Conclusion
Under the unit-value rule, domestic plants met 10–14% of home use of lubricants in 2024, against an average of 14–16% in 2015–2018 (without 2016), largely by blending imported inputs. By the same rule, output growth from the trough of the base years came mainly from exports, and the import-substitution component changes sign across periods. Dependence on imports did not shrink. Imports rose by 55.0 thousand tonnes, about twice the gain in output, imports net of the input codes by 21.7, and the share of home use met at home showed no lasting rise. The dependence moved upstream and, for base oils, returned to its earlier reliance on Russian supply. Whether a base-oil unit at Atyrau or a re-refining network fed by domestic waste oil can compete remains open.
Data Availability
All data are public: the UNSD Energy Statistics Database (commodity 4692, UNdata SDMX service) and Bureau of National Statistics tables of exports and imports by ten-digit EAEU code (stat.gov.kz), both in releases up to 27 July 2026. The calculation scripts are available from the author on request.
Declaration of Interest
The author is General Director of HILL Corporation LLP, one of the lubricant producers discussed in this article. The company operates a lubricant blending plant and a used-oil re-refinery and has planned a base-oil plant; the policy options discussed here concern segments in which it operates or competes. The analysis relies only on public statistics and published sources; no company data were used.
References:
Akhmetova, Ya. (2026, January 23). V Kazakhstane stroyat zavod motornykh masel po mezhdunarodnym standartam [Kazakhstan is building a motor oil plant to international standards]. Forbes Kazakhstan. https://forbes.kz/articles/v-kazahstane-stroyat-zavod-motornyh-masel-po-mezhdunarodnym-standartam-a20020 (In Russ.)
Aubakirova, G. M., Isataeva, F. M., & Biryukov, V. V. (2023). Import substitution as a development strategy for countries in transition: The experience of Kazakhstan. Central Asian Economic Review, (5), 21–37. https://doi.org/10.52821/2789-4401-2023-5-21-37 (In Russ.)
Aubakirova, G. M., Zhuparova, A. S., & Kozhakhmetova, A. K. (2025). Diversification of the Kazakhstan economy through global value chains: A quantitative assessment. Economy: Strategy and Practice, 20(1), 103–119. https://doi.org/10.51176/1997-9967-2025-1-103-119
Bureau of National Statistics. (2026). Eksport i import tovarov Respubliki Kazakhstan po 4, 6, 10 znakam TN VED EAES, 2015–2025 [Export and import of goods of the Republic of Kazakhstan by 4, 6 and 10 digits of the EAEU Commodity Nomenclature, 2015–2025] [Data set]. Agency for Strategic Planning and Reforms of the Republic of Kazakhstan. Retrieved October 7, 2026, from https://stat.gov.kz/ru/industries/economy/foreign-market/spreadsheets/ (In Russ.)
Cabrera-Escobar, C., Moreno-Gutiérrez, J., Rodríguez-Moreno, R., Pájaro-Velázquez, E., Calderay-Cayetano, F., & Durán-Grados, V. (2025). A review on global recovery policy of used lubricating oils and their effects on the environment and circular economy. Environments, 12(5), 135. https://doi.org/10.3390/environments12050135
Government of the Republic of Kazakhstan. (2022). Ob utverzhdenii Programmy razvitiya vnutristranovoy tsennosti i eksportoorientirovannykh proizvodstv [On approval of the Program for the development of in-country value and export-oriented production] (Resolution No. 452 of 30 June 2022). Adilet. https://adilet.zan.kz/rus/docs/P2200000452 (In Russ.)
Irwin, D. A. (2021). The rise and fall of import substitution. World Development, 139, 105306. https://doi.org/10.1016/j.worlddev.2020.105306
Juhász, R., Lane, N., & Rodrik, D. (2024). The new economics of industrial policy. Annual Review of Economics, 16(1), 213–242. https://doi.org/10.1146/annurev-economics-081023-024638
Kamchev, B. (2010, June 16). Kazakhstan opens blending facility. Lube Report. https://www.lubesngreases.com/lubereport/10_24/kazakhstan-opens-blending-facility/
Kamchev, B. (2014a, July 2). Kazakhstan bans lube exports. Lube Report. https://www.lubesngreases.com/lubereport/14_27/kazakhstan-bans-lube-exports/
Kamchev, B. (2014b, September 2). Kazakh lube plant postponed. Lube Report Asia. https://www.lubesngreases.com/lubereport-asia/1_35/kazakh-lube-plant-postponed/
Kamchev, B. (2016, March 8). Kazakh lube producer stumbles. Lube Report Asia. https://www.lubesngreases.com/lubereport-asia/3_10/kazakh-lube-producer-stumbles/
Kamchev, B. (2019a, February 5). Hill Corp. opened base oil rerefinery. Lube Report EMEA. https://www.lubesngreases.com/lubereport-emea/2_6/hill-corp-opened-base-oil-rerefinery/
Kamchev, B. (2019b, September 24). Lukoil opens blending plant in Kazakhstan. Lube Report EMEA. https://www.lubesngreases.com/lubereport-emea/2_39/lukoil-opens-blending-plant-in-kazakhstan/
Karabassova, N. A., Khairudinov, R. I., Bukanova, A. S., & Kairliyeva, F. B. (2025). Application of hydrocatalytic processes for producing lubricants at the Atyrau oil refinery. Neft i Gaz, 149(5), 156–165. https://doi.org/10.37878/2708-0080/2025-5.11 (In Russ.)
Moldashev, K. (2023). The effects of trade related sanctions on Russia on Kazakhstan’s international trade in goods. Eurasian Journal of Economic and Business Studies, 67(4), 38–48. https://doi.org/10.47703/ejebs.v67i4.321
Nas, Ş., Maya, M., & Tuncer, İ. (2023). Structural change and growth prospects in the Turkish economy: A demand-side decomposition analysis. E+M Ekonomie a Management, 26(1), 25–44. https://doi.org/10.15240/tul/001/2023-1-002
Tregenna, F. (2012). Sources of subsectoral growth in South Africa. Oxford Development Studies, 40(2), 162–189. https://doi.org/10.1080/13600818.2012.677422
United Nations Statistics Division. (2025). Energy statistics database: Lubricants (Update of December 15, 2025) [Data set]. UNdata. https://data.un.org/
Other articles of the issue